Electrophoresis Band BP Calculator
Estimate DNA Size from Gel Image

What is the Electrophoresis Band BP Calculator?
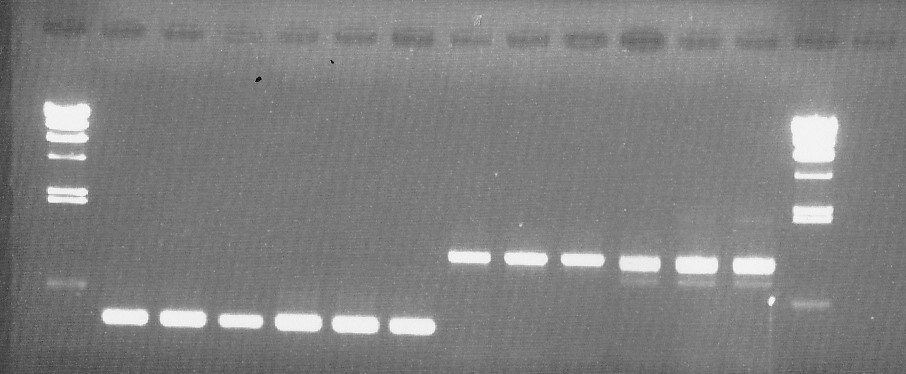
The Electrophoresis Band BP Calculator is a web-based analytical tool designed to estimate DNA fragment sizes (bp) from gel electrophoresis images using a semi-log calibration approach. By defining known marker bands and generating a regression curve, unknown sample bands can be automatically converted into base pair values. This tool is suitable for agarose and polyacrylamide gel analysis in molecular biology, biotechnology, and genetic research workflows.
How to Use
1. Select Gel Image:
Click "Select Gel Image" and choose your gel electrophoresis image file from your device.
2. Upload Image:
Click the "Upload Image" button to display the gel image in the analysis area.
3. Adjust Start Line:
Drag the blue Start Line to align it with the sample loading position (well origin) of the gel.
This line defines the migration starting point for distance measurements.
4. Add Marker Bands:
Click "Add Marker" to generate a blue marker line.
Drag the marker line to match the position of each visible ladder band.
Enter the corresponding known base pair (bp) value into the input box.
Repeat this process for all detectable ladder bands.
At least two markers are required to generate a calibration curve.
5. Add Sample Bands:
Click "Add Sample" to generate a red sample line.
Drag the red line to align with each sample band whose size you wish to estimate.
6. Generate Calibration Curve:
Click "Generate Curve".
A semi-log regression curve will be generated from the marker bands,
and estimated base pair values will automatically appear next to each sample band.
The calculation is based on linear regression between migration distance and log10(bp), following standard electrophoresis size estimation principles.
